1 October 2026
Biggest boost
2 outlets

Labour
Andy Burnham
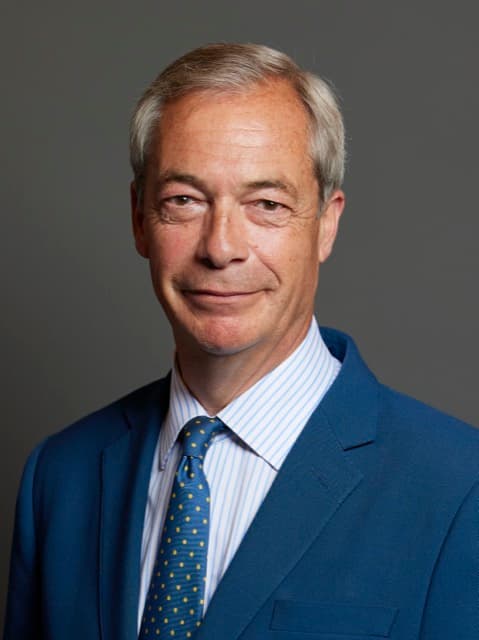
Reform
Nigel Farage

Conservative
Kemi Badenoch

Green
Zack Polanski

Lib Dems
Sir Ed Davey
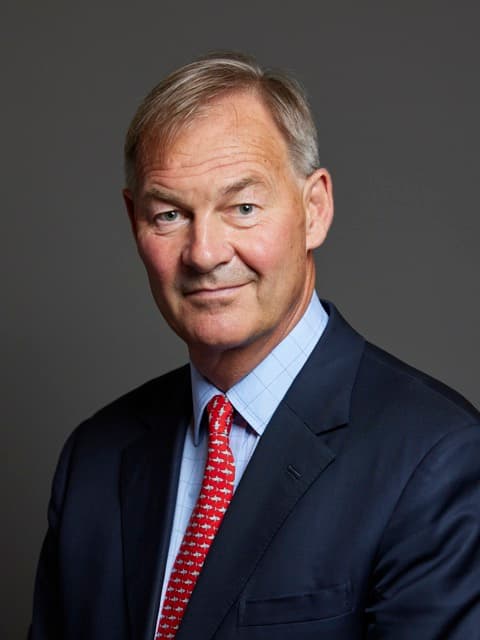
Restore
Rupert Lowe
Rolling average of published British Polling Council polls · 26 September 2026 · Source: PollCheck, 7-poll moving average · Photograph: Peter McDermott / CC BY-SA 2.0
Our mission
Give British people the knowledge to vote with confidence, and the power to change the nation they love for the better.
 Terrorism threat levelSevereAn attack is highly likelyOfficial
 Russia pressure on the UK55/100ElevatedOur assessmentPM approval+1637% approve, 21% disapproveOpinium
 Channel crossings, 202615,24240% lower than this point in 2025Home Office
 Labour lead over Reform+3.2ptsRolling average of BPC pollsPollCheck
 Next general election1,048daysBy 15 August 2029 at the latestFixed-term rules
New to this?
Broadly, the left favours more state spending and looser immigration rules; the right favours lower taxes and tighter ones. Each column says where a party sits and what that means in practice, how we place them.
Select a party for our placement and the reasoning behind it.
Your area
All 650 seats: your MP, how they won, the full result with every candidate on the ballot, and how safely the seat is held. Enter a postcode, your town, or the constituency name.
Or browse all 650 if you would rather scroll than type.
34,000 towns and villages mapped to the 2024 boundaries.
The papers
Reading the front pages…
The rest of it
Everything the site holds, one tap away. Each page carries its sources on the same page as its figures.
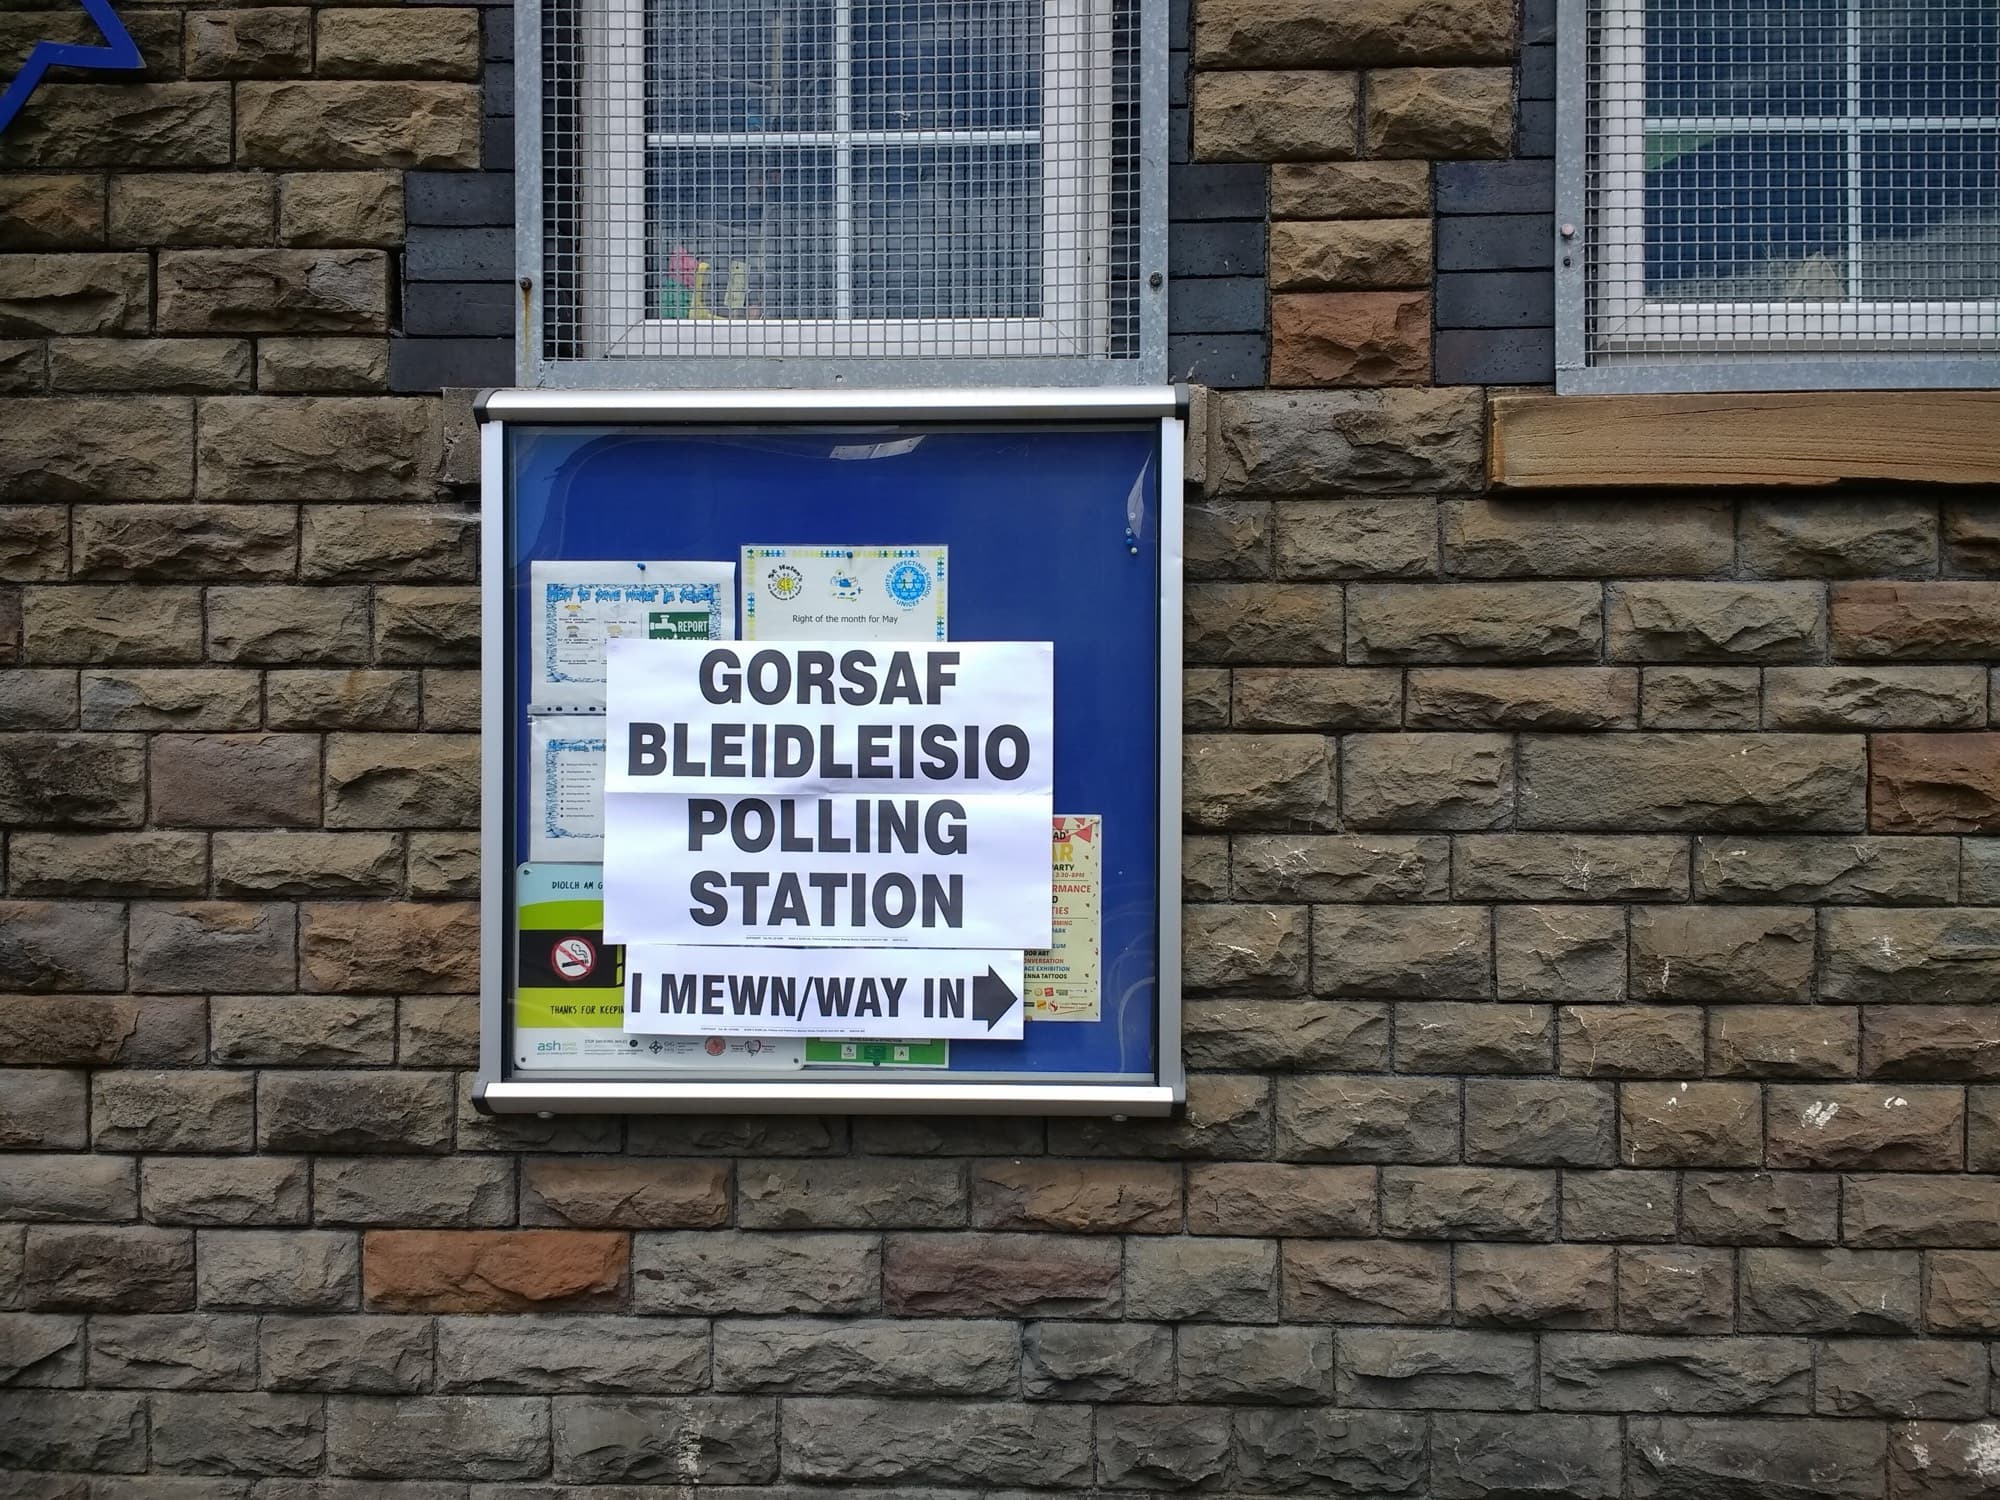 The polls themselvesThe polls inside the rolling average, with fieldwork dates and a link to each pollster's own write-up.ImmigrationChannel crossings year-to-date and by year, the asylum backlog, and where each party stands.Threats & alliancesThe official terrorism level, unadjusted, plus our own weighted read on Russia, Iran and China, and on what the UK can rely on from the US, NATO and Europe.The Prime MinisterApproval, the best-prime-minister head-to-head, and how the government is standing.
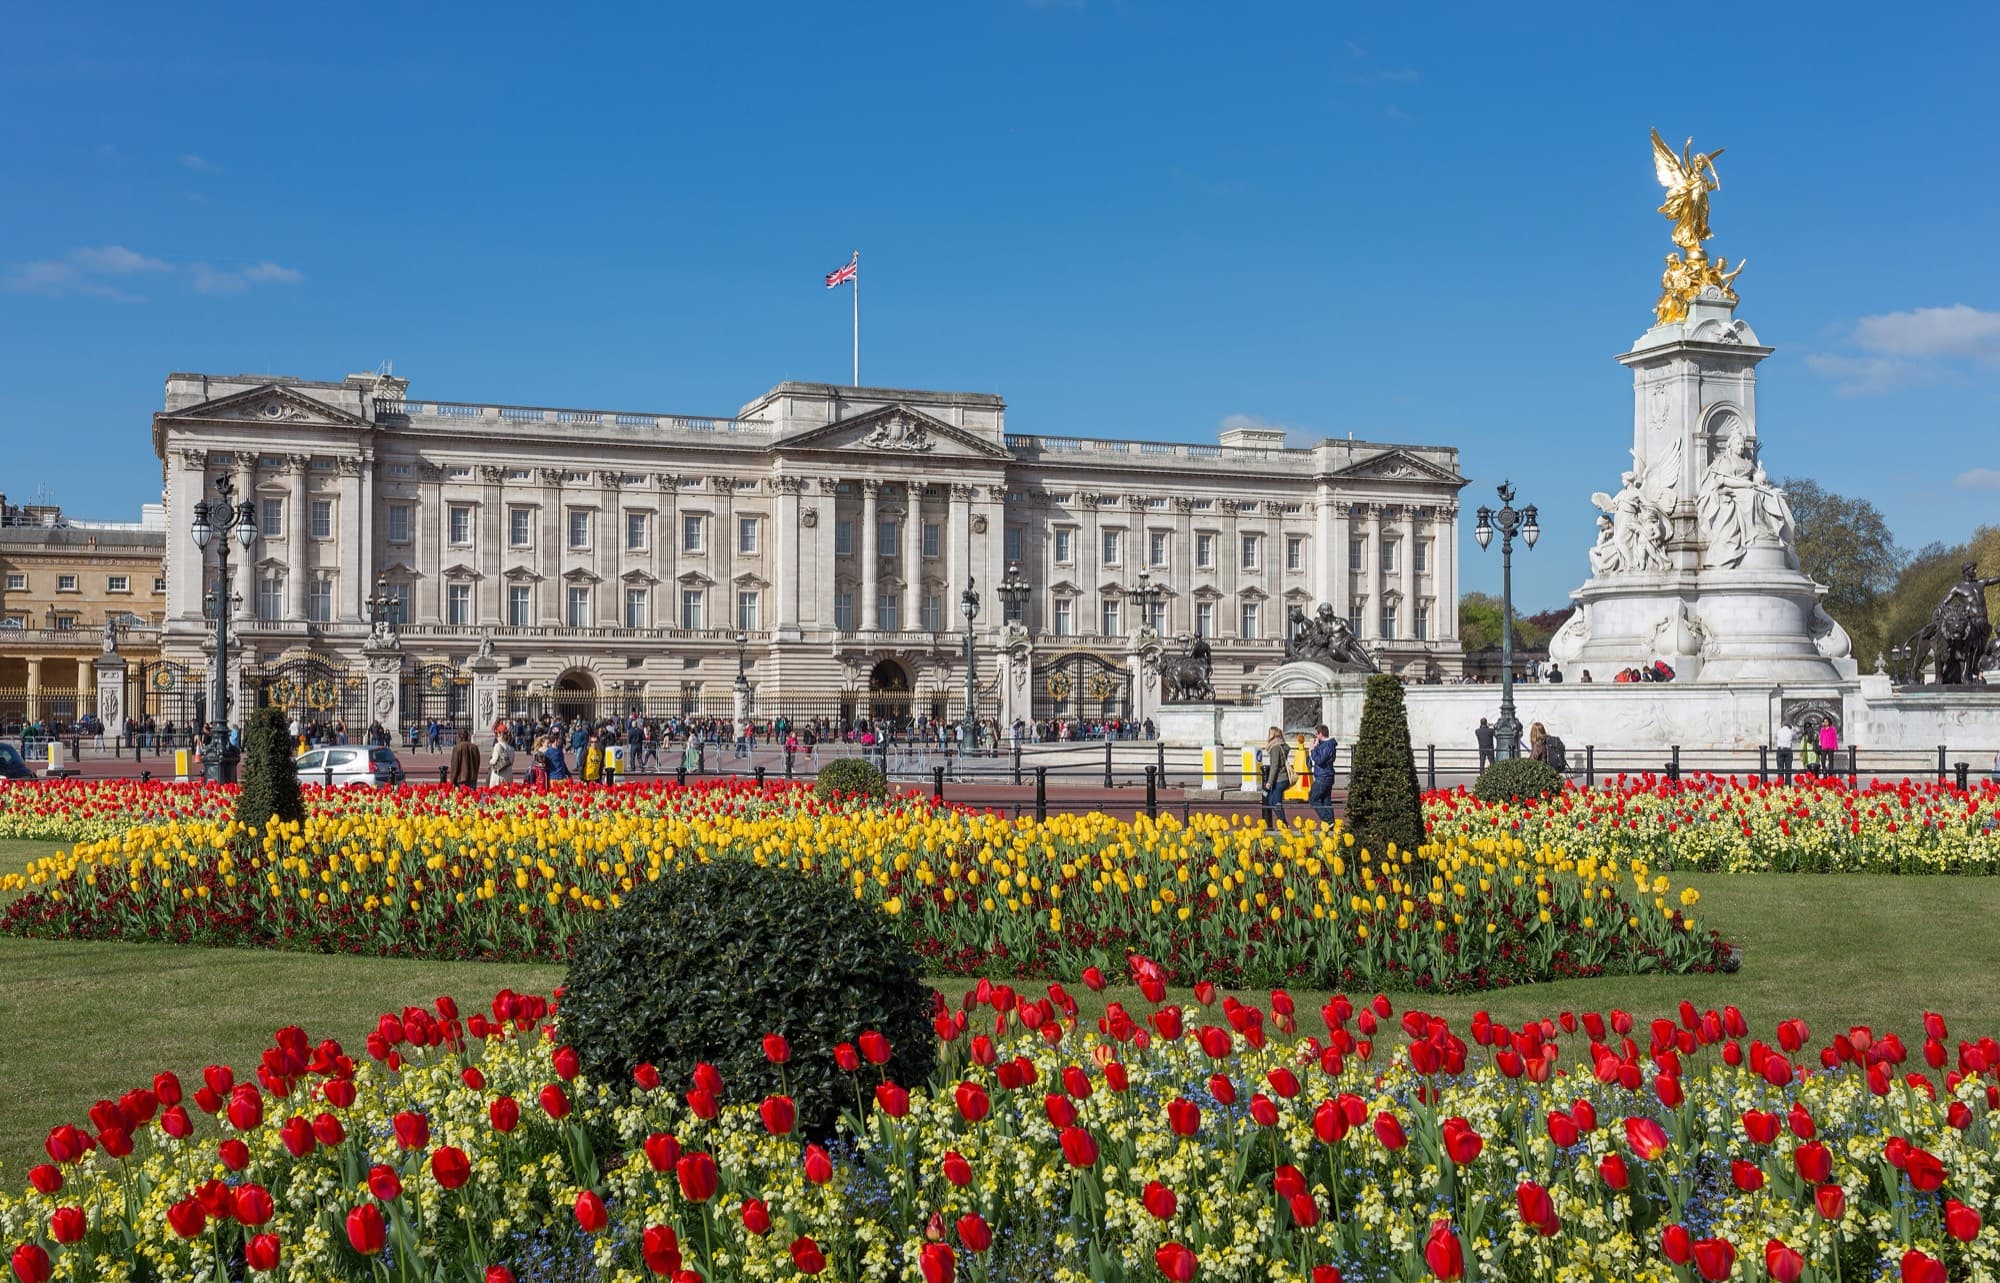 The six partiesPolicies, leadership, spectrum position, what each can credibly claim and what is fairly held against it.Compare the partiesEvery party answering the same ten questions, in the same order, side by side.
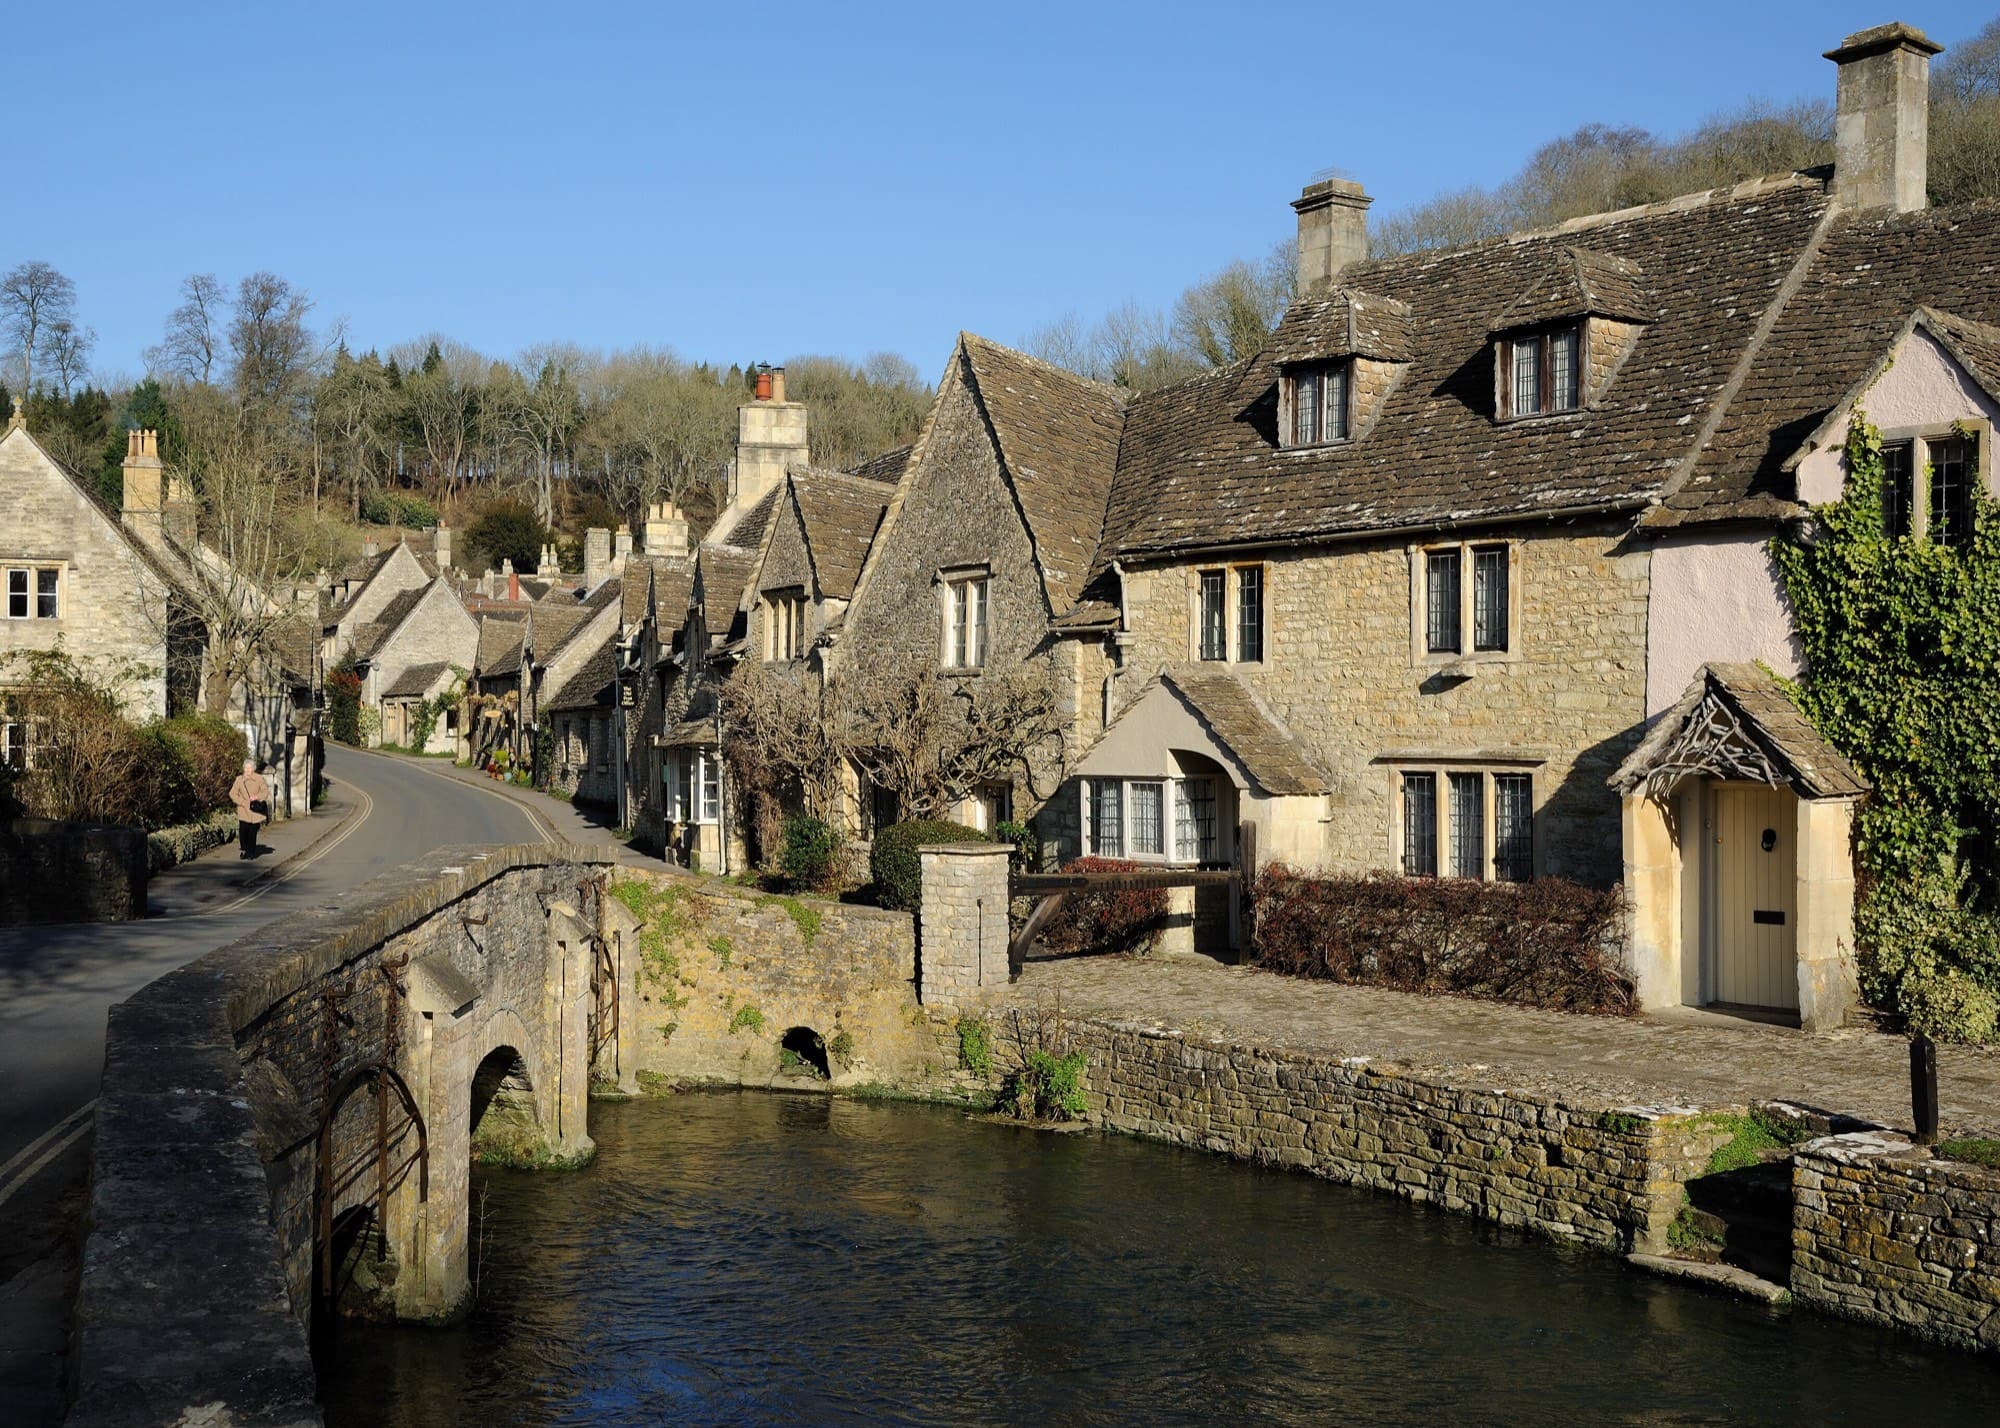 Your constituencyAll 650 seats: your MP, the full 2024 result with every candidate, turnout and the margin.
The calendar
1,048days
United Kingdom general election
15 August 2029 · latest possible
216days
Local elections
6 May 2027
216days
Northern Ireland Assembly election
6 May 2027 · expected
The papers
One event, as the left and the right each worded it. Every masthead is marked for where it sits.
1 October 2026
One of 132 stories in the feeds now. See every subject, and the rest of today’s coverage, on the news desk.